
Monitoring
The popularity of Microservices is on the rise; companies adopting this model increase by hundreds every day. Microservices are no longer limited to a few services. If your job is to manage these services, how will you make sure everything works as expected? No system is perfect, so when something does go wrong, how can you fix it quickly and with minimal disruption? Monitoring comes to the rescue!
What is Monitoring?
Monitoring is the process of taking proactive measures to gain insights into your services. These insights can be about the state of the system, memory usage or other aspects, depending on your use case.
As with most tasks, completing them manually is painstaking and inefficient. What’s more, it’s impossible to track, log, manage and review them, or alert people that they are complete.
Automation is the answer – but what features are important for your monitoring tools? And, won’t these tools themselves consume resources?
Prometheus
Prometheus is an open source project from SoundCloud, which began in 2012. According to the Cloud Native Computing Foundation(CNCF), it’s one of the most adopted projects in the cloud native ecosystem.
The function of Prometheus in its simplest form is to collect data continuously from the sources you specify, at intervals you specify. For example, “Capture CPU usage of a node named Name1 every two minutes.” Sources of data are called “targets,” data is called “metrics” and the process of collection with a time stamp is called “time series data.” The Alert Manager sends alerts to stakeholders based on metrics.
Prometheus works using a pull model, where it interacts with the target (application) to collect data. The target must expose metrics using the Prometheus format.
To view the metrics, you can use PromQL, a query language designed to work with Prometheus.
One of the benefits of Prometheus is that it monitors itself by exposing usage metrics. Although you get some basic visuals of the metrics, it is not robust enough to provide in-depth insights. Grafana can be used to extend and abstract the complexities of Prometheus.
Grafana
Grafana is an open source data analytics solution. In simple terms, it takes in data from one or more sources, analyzes it and presents it visually. In our case, the data source is from Prometheus. You can query and analyze your metrics without having to write PromQL queries.
Grafana also simplifies the process of adding new contact points (email, slack, etc.) for your alerts.
Example
Let’s now practice what we learned so far. Assume you are an Admin and tasked with implementing a system that detects when a Kubernetes Job fails and sends out an alert. Following is the simplest way possible to configure this process;
Step 1: Identify the metrics that can help you achieve this goal.
Find about kube-state-metrics, a Kubernetes project to export state metrics in Prometheus format.
To figure out the exact metrics, you can use Awesome Prometheus Alerts to look for metrics related to Kubernetes:
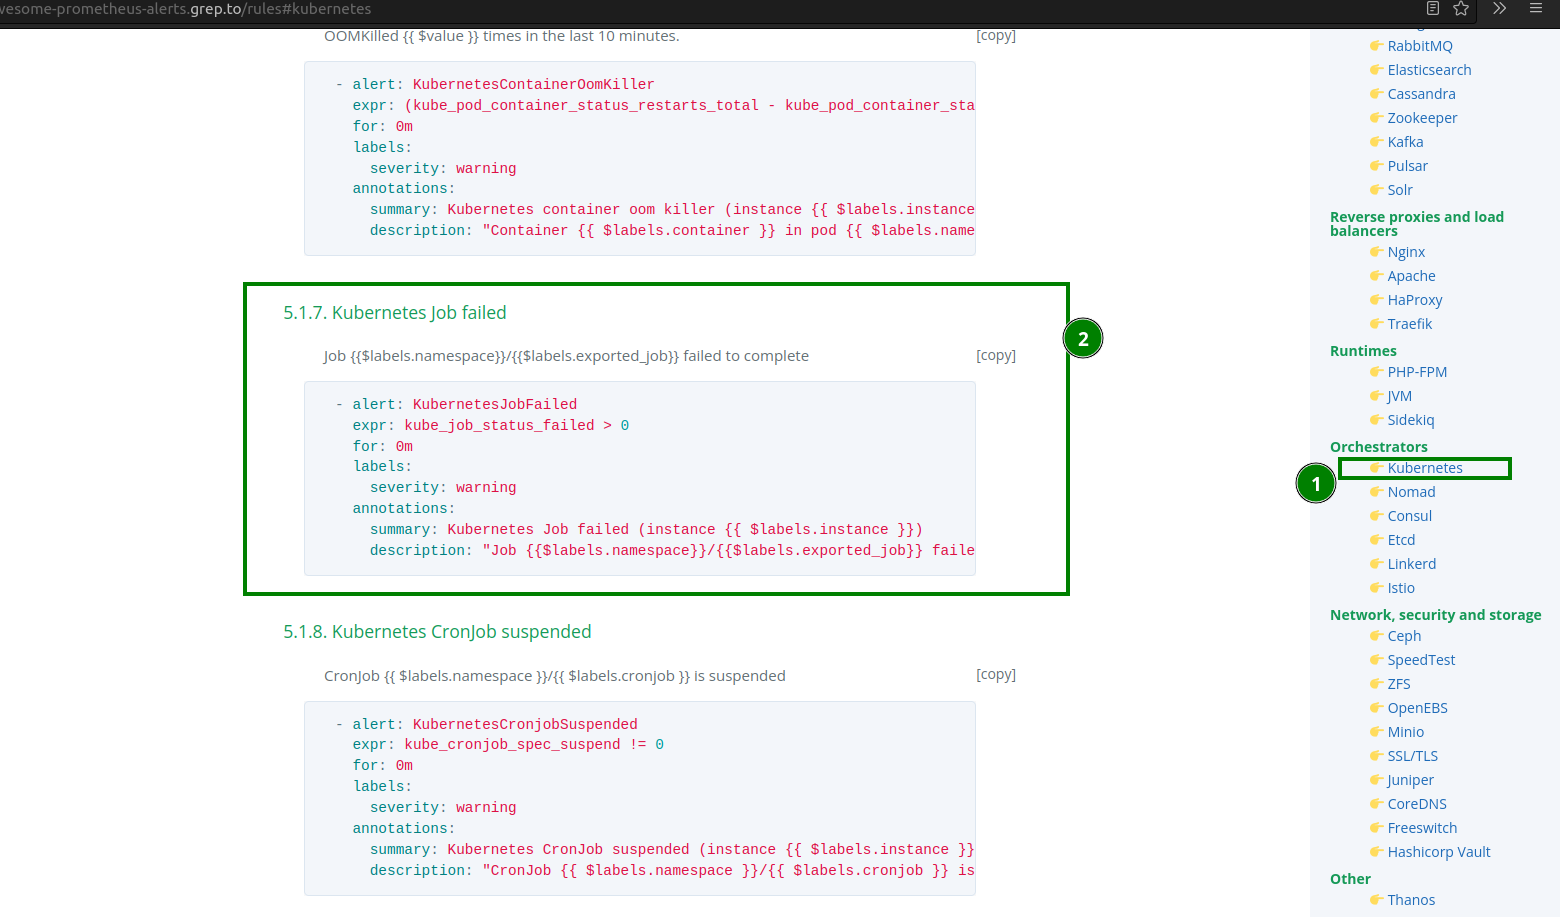
Use kube_job_status_failed to configure it to work with Grafana.
Step 2: Install Prometheus and Grafana using Helm.
You can use Minikube or any Kubernetes cluster. If you don’t have Helm installed, use this website to install it on your host OS:
Now add kube-prometheus-stack repo using:
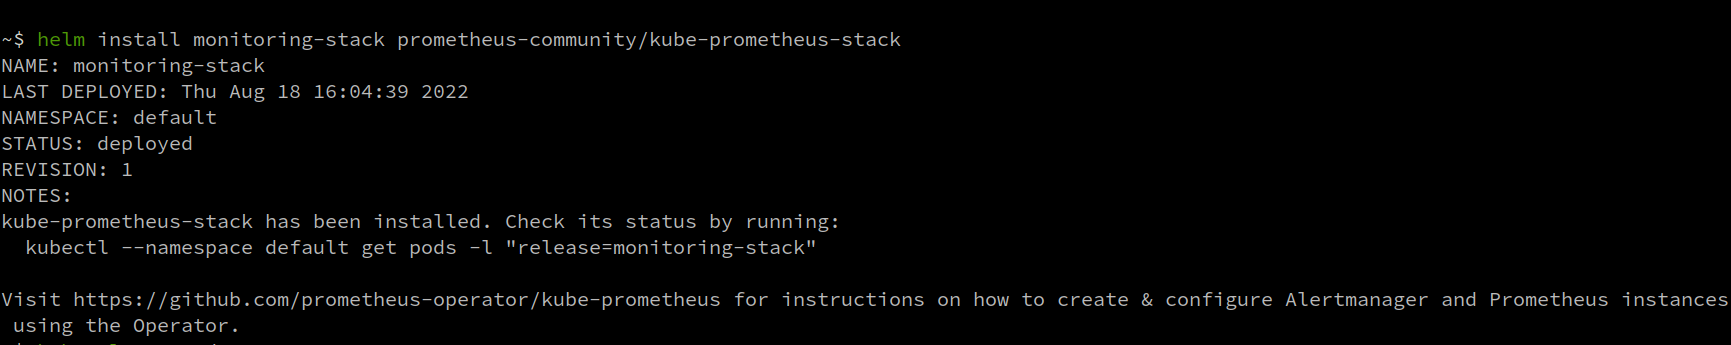
helm repo add prometheus-community https://prometheus-community.github.io/helm-charts & helm repo update
Next, run helm install monitoring-stack prometheus-community/kube-prometheus-stack, where monitoring-stack is the release name:
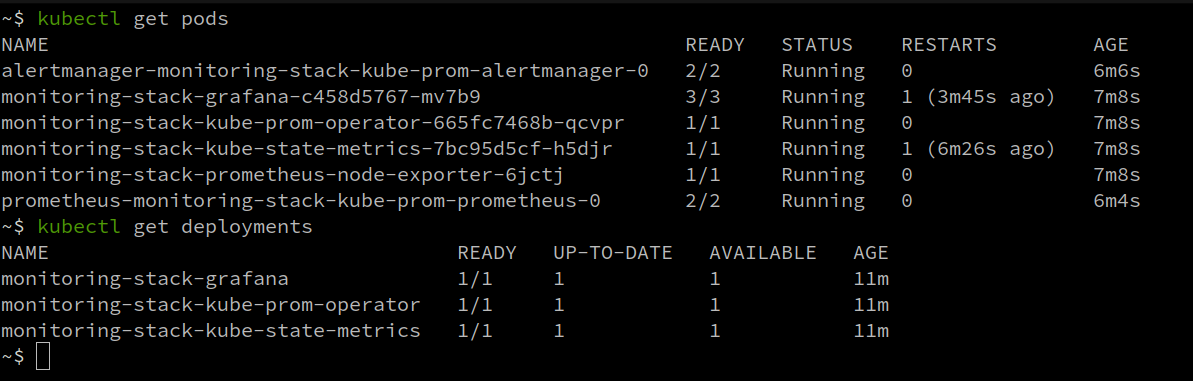
Once you have everything running, move to step 3.
Step 3: Access Grafana UI and create an alert.
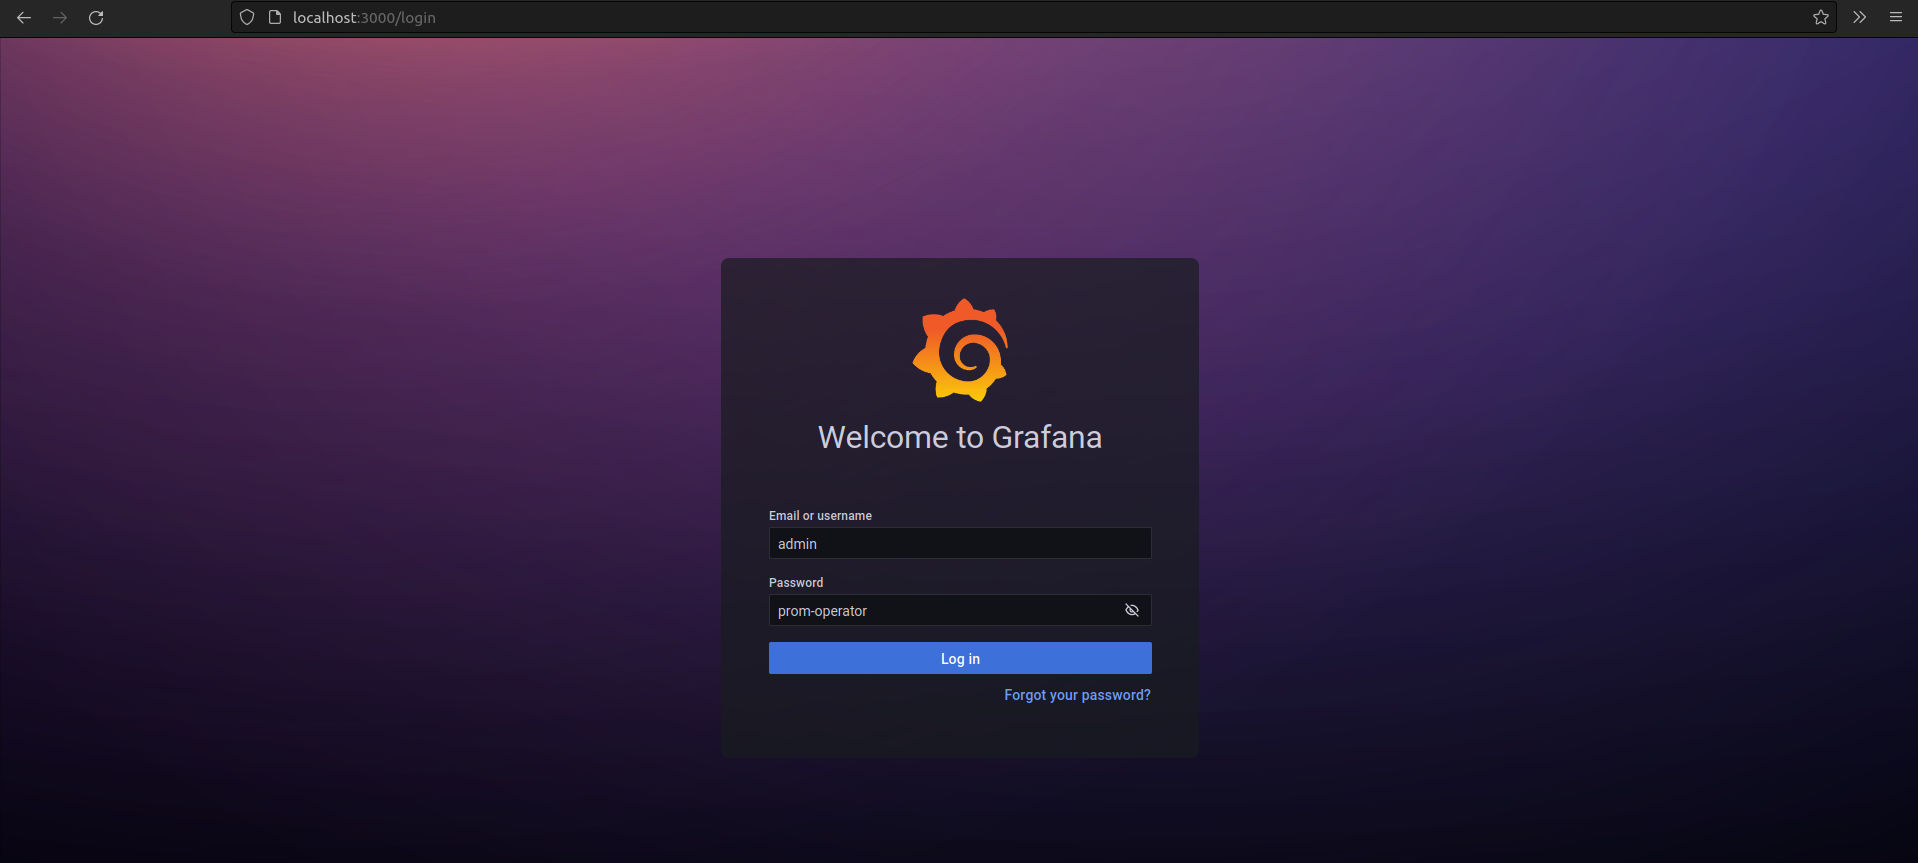
To access the Grafana dashboard, port forward the Grafana deployment, (monitoring-stack-grafana). Run kubectl port-forward deployments/monitoring-stack-grafana 3000. Use admin as the default username and prom-operator as the default password:
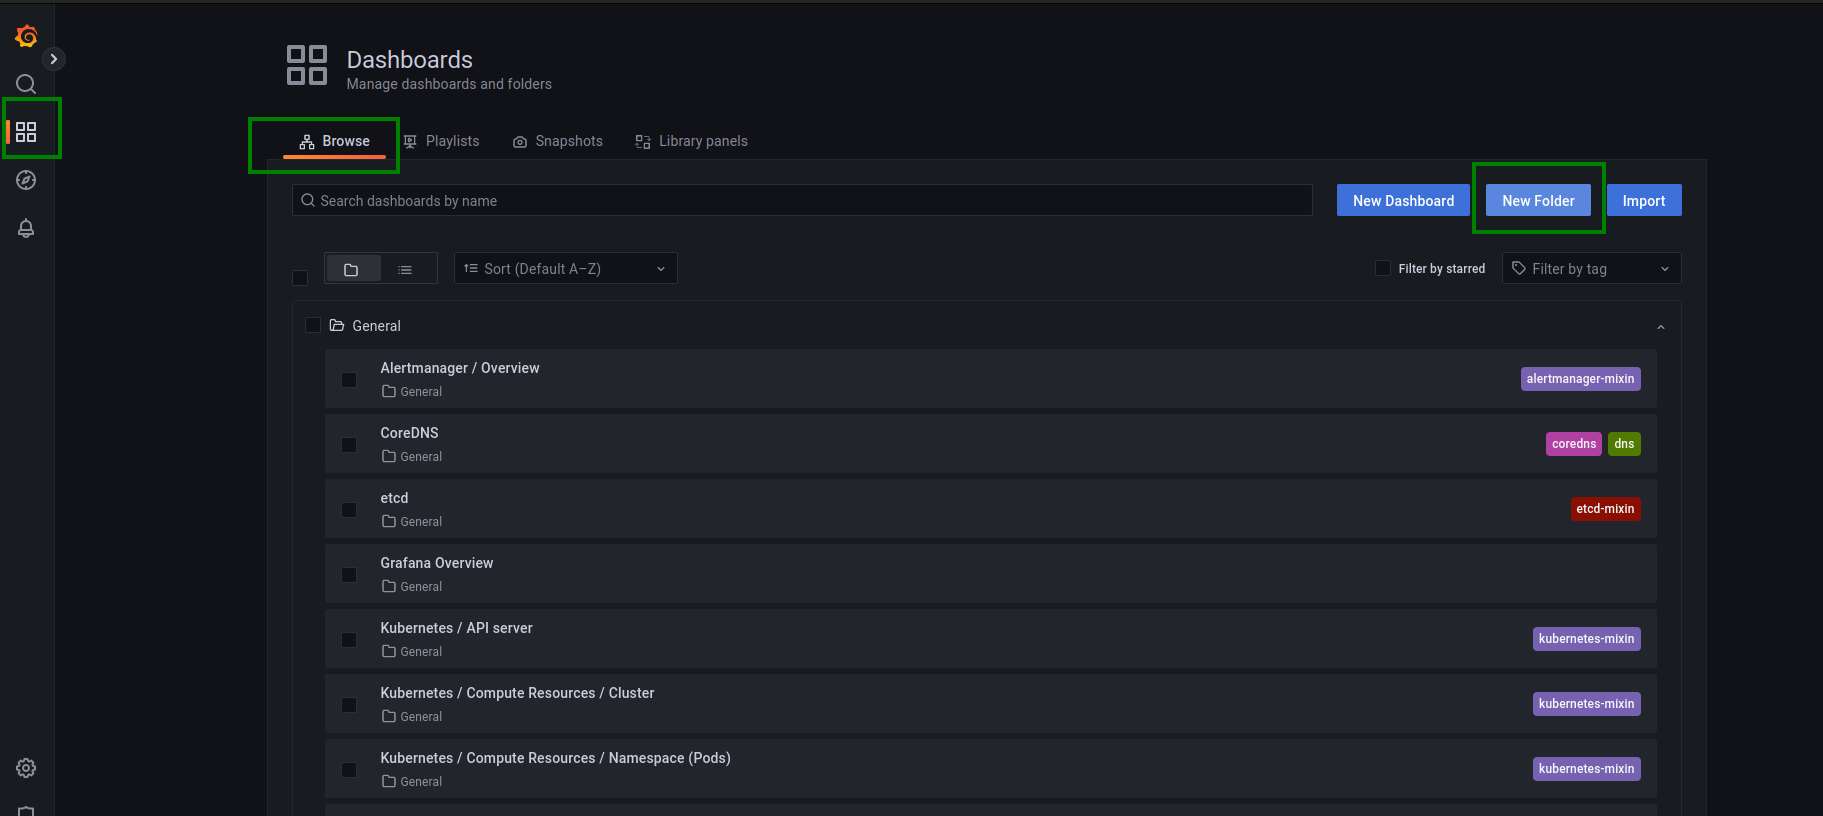
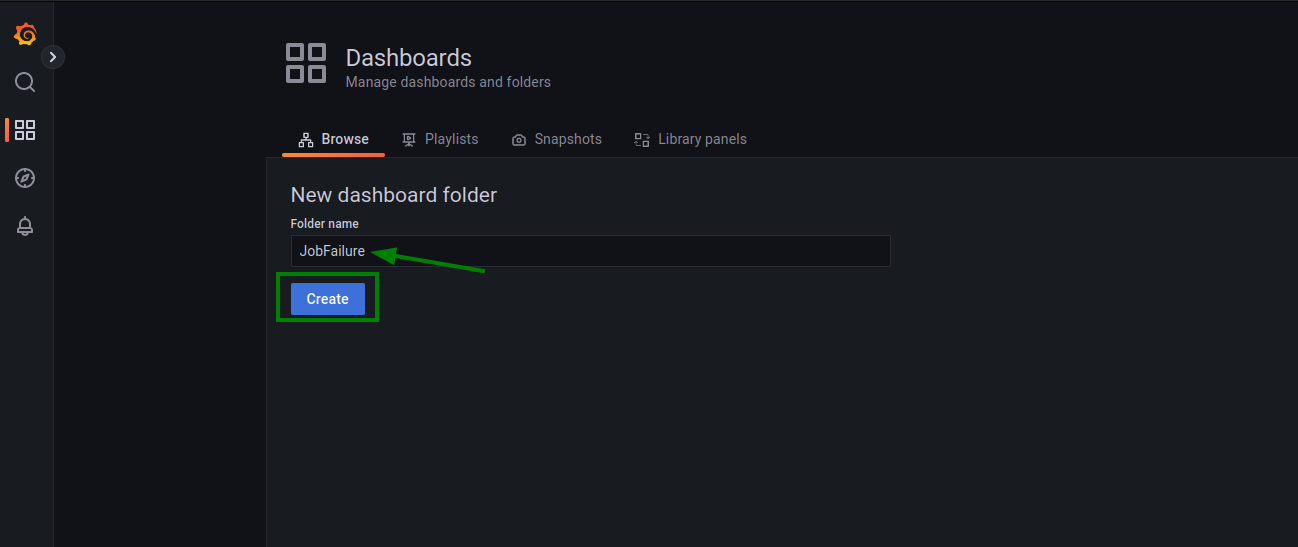
Now, create an Alert/dashboards using a Folder:
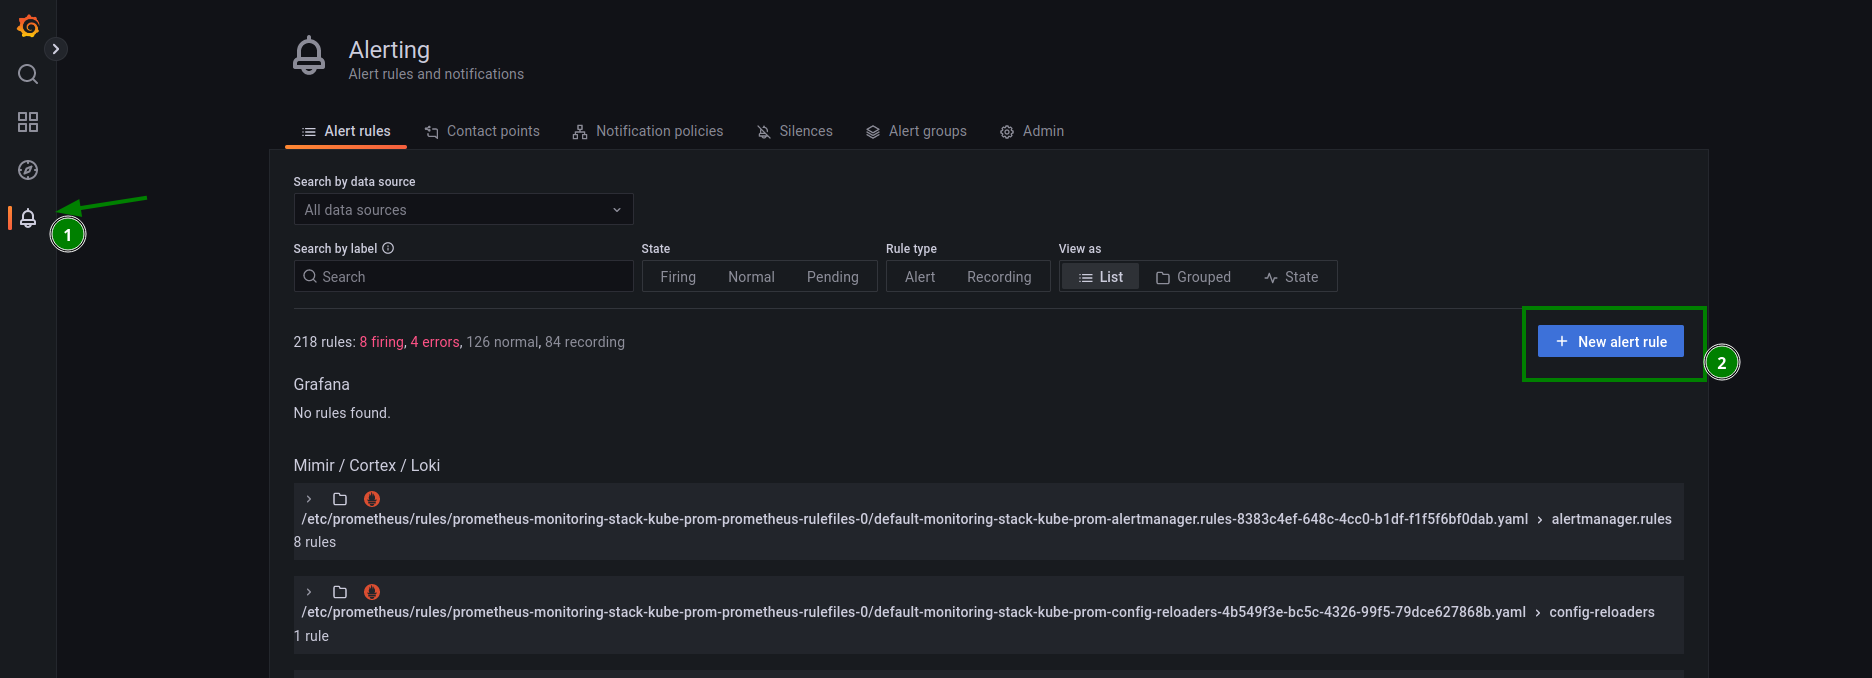
Next, create a new alert:
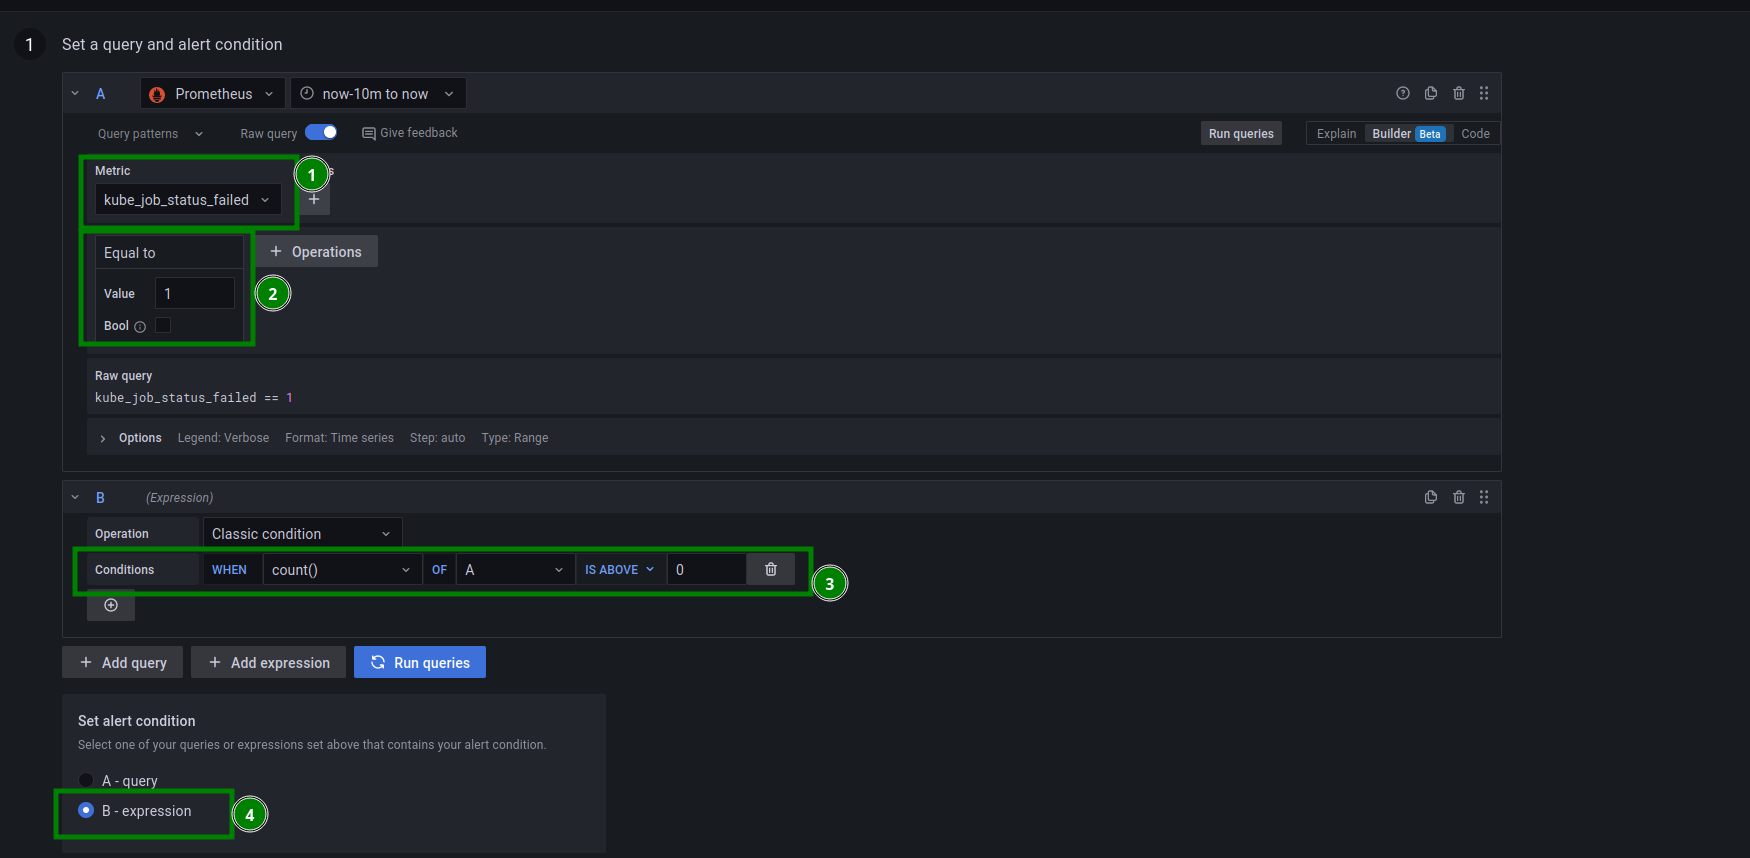
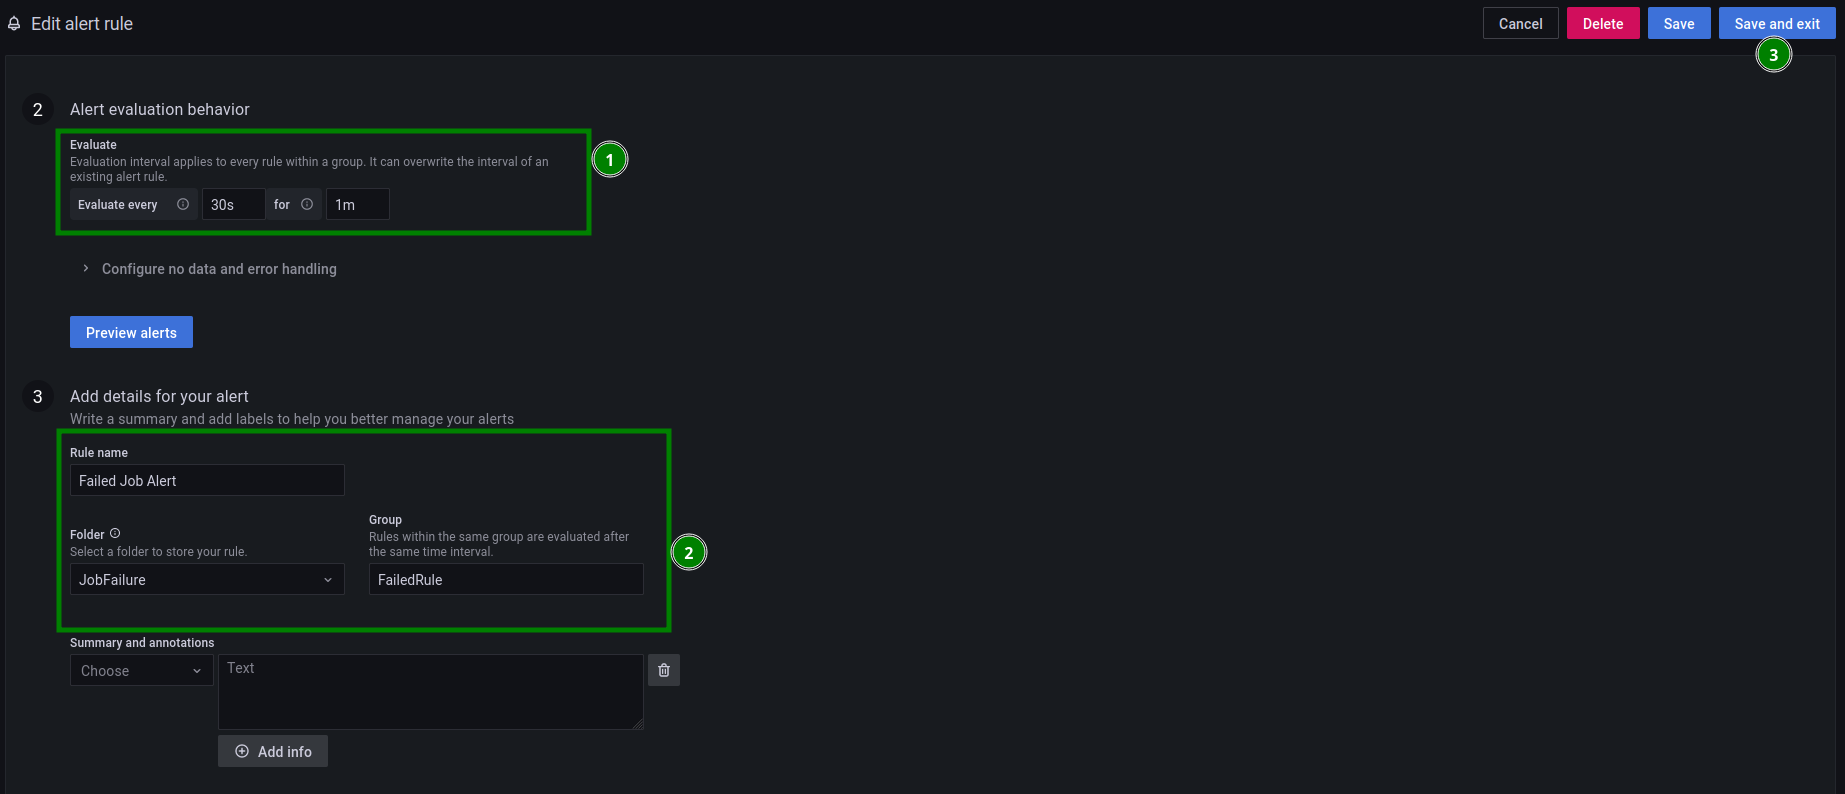
In the new alert rule, select the kube_job_status_failed metric. Click Operation and choose Binary operation/Equal to. This alert is triggered if the number of kube_job_status_failed == 1 is greater than 0:
This alert will run every 30 seconds, and if kube_job_status_failed == 1 is true for 1 minute, an alert is triggered:
And you’re done! Time to test!
Step 4: Test the solution with a Kubernetes Job
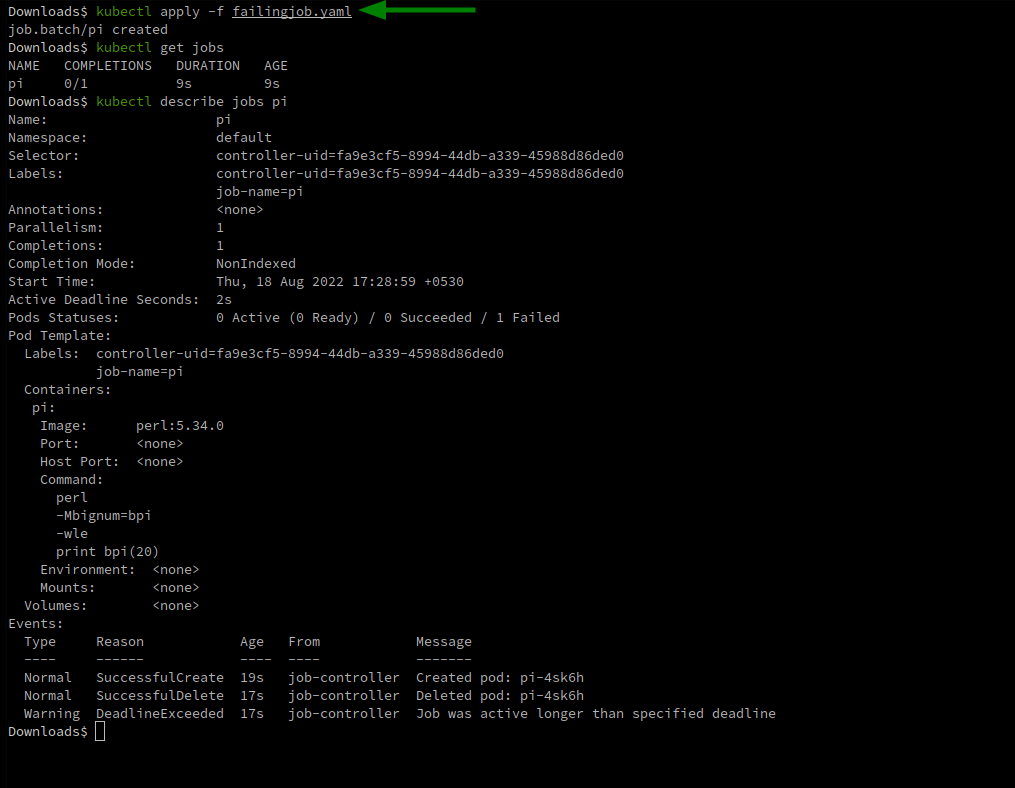
Use the following YAML file from Kubernetes Docs with some tweaks. activeDeadlineSeconds: 2 makes sure the job status is set to “failed” if it did not run within 2 seconds. Save the following code into a .yaml file:
apiVersion: batch/v1
kind: Job
metadata:
name: pi
spec:
template:
spec:
containers:
- name: pi
image: perl:5.34.0
command: ["perl", "-Mbignum=bpi", "-wle", "print bpi(200)"]
restartPolicy: Never
activeDeadlineSeconds: 2
Run kubectl apply -f <filename>.yaml
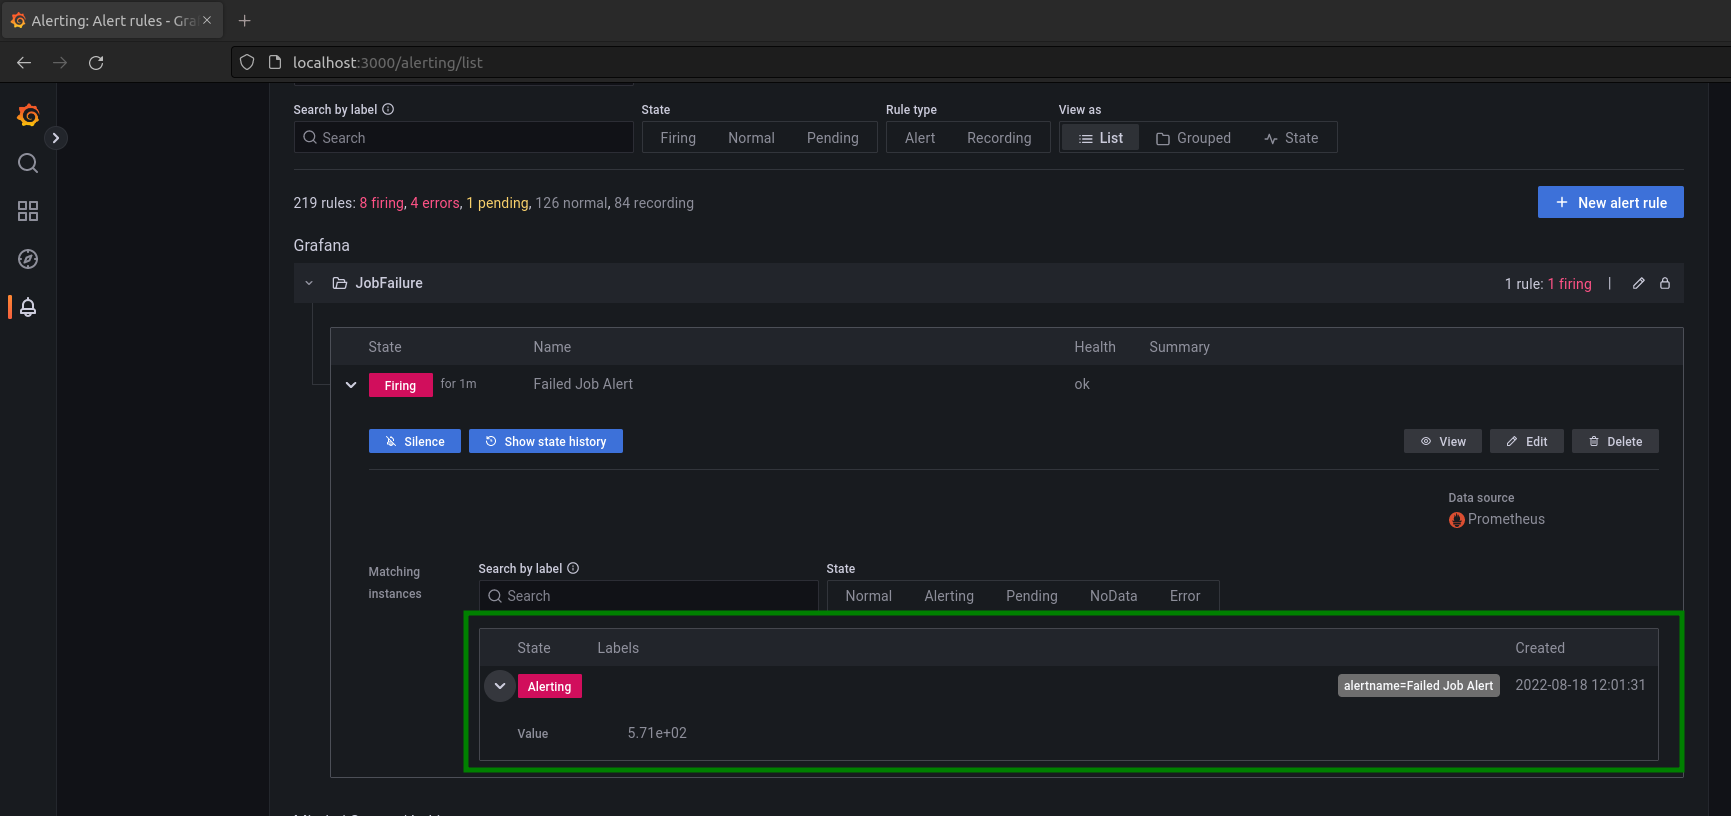
Jump into Grafana and wait for the alert state to change from Normal to Pending, then to Alerting:
To learn more about monitoring with Prometheus and Grafana, please see Course 14 on KubeCampus.io.