
Debugging Kubernetes applications can be a bit daunting at first if you don’t know what you are looking for. I have spent hours troubleshooting and debugging applications, and in doing so, have found a process and tools to quickly find and fix issues within a Kubernetes cluster. I’ve decided to write a blog post in hopes of making this process easier for others.
Some of the most common issues faced when deploying Kubernetes include misconfigured YAML or Pods, such as using an incorrect image name or the wrong ports. Let’s take a look at these issues in more detail.
Misconfigured YAML
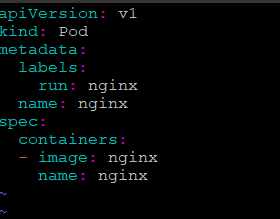
YAML relies on indentation (spaces, not tabs) to determine its hierarchy. In the case of the pod (application) definition file below, the indentation on the image field under the container spec is incorrect. This breaks the hierarchy and moves the image field out from under the containers section where it needs to be, thus invalidating the syntax.
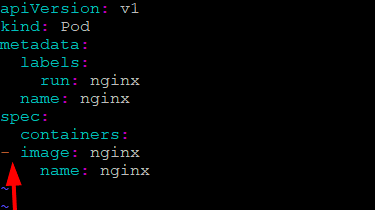
When attempting to apply this pod definition file, it returns an error and doesn’t create the pod. It states that line 8 is incorrect. (There are multiple websites and CLI tools that you can use to validate this, for example http://www.yamllint.com/.)

Kubernetes will do a syntax check and produce an error if the YAML syntax is incorrect, but it doesn’t check the configuration values you provide – for example, the image to be used by the container.
Pod (Application) Misconfiguration
First, let’s take a step back to understand that there are essentially two high-level phases that a pod will go through when starting.
The first phase provides the Kubernetes preparation mechanisms: scheduling, resource allocation (cpu, ram allocations) and associations (secrets, storage etc.), as requested by the pod definition.
In the second phase, the application transitions to a running state.
Let’s explore a scenario for each type of failure – one occurring during Kubernetes preparations and getting the pod ready to run, and the other occurring when the pod is running.
Incorrect Image Name
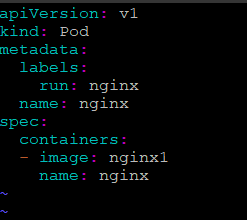
If an incorrect image name is provided in a pod definition, Kubernetes doesn’t care. It will consider the YAML valid but fail to create the pod. Let’s see what an incorrect definition file looks like by attempting to deploy a simple nginx pod.
We’ll use the example pod definition above but change the name of the image to nginx1:
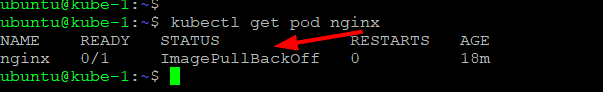
The pod will create successfully, since the YAML is syntactically correct, but if we check on the pod, it is not in a healthy state. This is due to Kubernetes validating the YAML but not the values provided.
How do you troubleshoot this issue? Where would you start? What kubectl commands can be used?
Use kubectl get and kubectl describe to assist in troubleshooting the Kubernetes preparation phase.
kubectl describe will print a detailed description of the selected resources, including related resources such as events or controllers. This will gather information directly from Kubernetes.
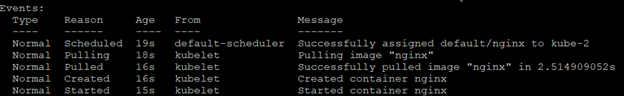
Let’s start by inspecting the pod by running “kubectl describe pod nginx.” This will output all the information about the pod. Toward the end of the output, the event log will appear, providing an indication as to why it failed.
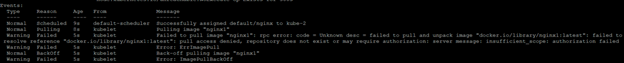
Upon inspecting the pod, we notice the pod is failing to pull the image from docker hub due to the image “nginx1” not existing.
By rectifying the image name and re-creating the pod using the definition file, we now have a successful pod creation.
Once Kubernetes is able to meet all the requests of the pod in the preparation phase, it will provision the pod and it’s accompanying resources. After that, it’s up to the application to do what is required for it to become functional.
Application Listening on the Wrong Ports
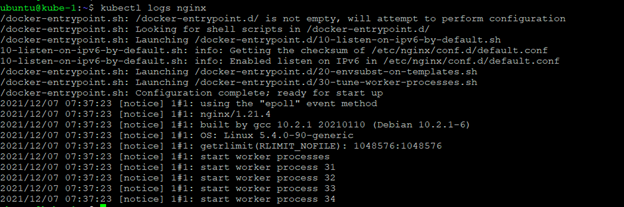
Debugging a pod is when we would use the command kubectl logs to assist in troubleshooting the application itself.
kubectl logs will print the logs for a container in a specific pod, providing more verbose logs for the container. This pulls the logs from the application or pod specifically.
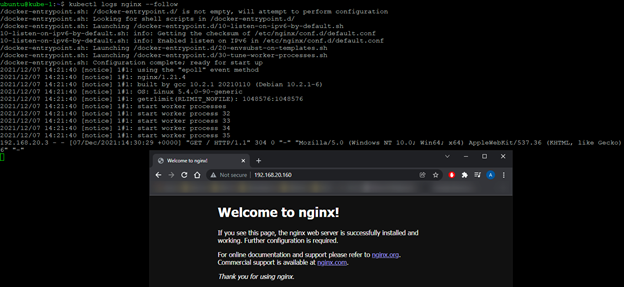
When viewing the logs, we can see that the kubectl log command is displaying information from within the pod, and we can see that the nginx application has started, confirming the pod has likewise started correctly.
Let’s take a step further. Following the same process, we can troubleshoot port connectivity to the container by exposing the nginx container via a LoadBalancer on port 81.

Now let’s run the command “kubectl logs nginx –follow”. What this will do is follow the log in real time, so we can troubleshoot the connectivity issue.
Refreshing the web page doesn’t add any additional lines to the log file, so we can be confident no outside traffic is reaching the pod. Let’s troubleshoot:
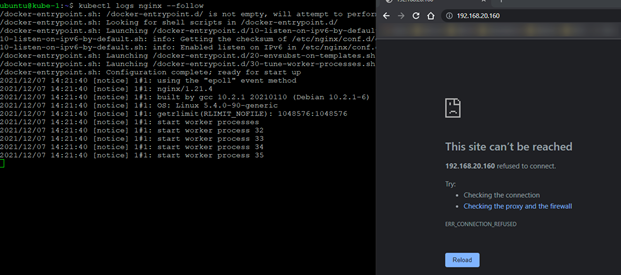
By running “kubectl describe service nginx,” we see that the target port has been set to port 81. This is the incorrect port, as port 80 is required to display the nginx homepage.
Rectifying the nginx service to use the correct port and refreshing the web browser tab, we can now see additional lines in the logs stating we have successfully connected to the pod. Note that both the pod and service definitions contain port information, so we will need to check both.
This was a simple example of how to troubleshoot a pod that isn’t starting correctly. However, keep in mind the same technique is used to troubleshoot other Kubernetes resources, such as deployments or persistent volumes, even at scale. Whether you are troubleshooting a single pod or a full-blown production application, the basis will stay the same.
Armed with these two commands, you should be able to troubleshoot your application with success.
I hope this was a helpful quick overview and, as always, keep on learning!